Gene imputation with scRNA and smFISH in mouse cortex
Given two single-cell datasets profiled with different modalities scConfluence can map each in low-dimensional latent space shared by both modalities where distances between cell embeddings depends only on their biological similarity. These latent embeddings can then be leveraged to impute features across modalities. We show here an example of integration on a scRNA dataset with an smFISH dataset both from the mouse somatosensory cortex.
Imports
[1]:
import warnings
warnings.simplefilter(action='ignore', category=FutureWarning)

from scipy.spatial.distance import cdist
import muon as mu
import numpy as np
import matplotlib.pyplot as plt
import scanpy as sc
import torch
torch.manual_seed(1792)

import scconfluence
/Users/julessamara/Projects/scconfluence/.venv/lib/python3.14/site-packages/tqdm/auto.py:21: TqdmWarning: IProgress not found. Please update jupyter and ipywidgets. See https://ipywidgets.readthedocs.io/en/stable/user_install.html
  from .autonotebook import tqdm as notebook_tqdm
Read data
You can download the unpaired multimodal dataset for this tutorial from https://figshare.com/s/72e156d0f131f8a3c810.
[2]:
mdata = mu.read_h5mu("RNA_smFISH_demo.h5mu.gz")
mdata
/Users/julessamara/Projects/scconfluence/.venv/lib/python3.14/site-packages/mudata/_core/mudata.py:613: UserWarning: Cannot join columns with the same name because var_names are intersecting.
  self._update_attr_legacy(attr, axis, join_common, **kwargs)
[2]:
MuData object with n_obs × n_vars = 7535 × 20005
  obs:      'celltype', 'modality'
  2 modalities
    fish:   4530 × 33
      obs:  'x_coord', 'y_coord'
      layers:       None
    rna:    3005 × 19972
      layers:       None
Perform basic quality control
We can use scanpy functions to filter out cells or features with low quality measurements.
[3]:
sc.pp.filter_cells(mdata["rna"], min_genes=10)
sc.pp.filter_genes(mdata["rna"], min_cells=20)

sc.pp.filter_cells(mdata["fish"], min_genes=5)
sc.pp.filter_genes(mdata["fish"], min_cells=20)
mdata.update()
mdata
/Users/julessamara/Projects/scconfluence/.venv/lib/python3.14/site-packages/mudata/_core/mudata.py:613: UserWarning: Cannot join columns with the same name because var_names are intersecting.
  self._update_attr_legacy(attr, axis, join_common, **kwargs)
[3]:
MuData object with n_obs × n_vars = 7528 × 15254
  obs:      'celltype', 'modality'
  2 modalities
    fish:   4523 × 33
      obs:  'x_coord', 'y_coord', 'n_genes'
      var:  'n_cells'
      layers:       None
    rna:    3005 × 15221
      obs:  'n_genes'
      var:  'n_cells'
      layers:       None
Hold out gene for imputation
To demonstrate scConfluence’s ability to impute feature expression across modalities we will hide from the smFISH data the expression of a gene which was measured in the smFISH experiment, then impute it using scConfluence and compare its imputation to its held out ground truth value.
[4]:
imputed_gene = "Sox10"
[5]:
assert imputed_gene in mdata["rna"].var_names and imputed_gene in mdata["fish"].var_names

heldout_counts = mdata["fish"][:, imputed_gene].X.copy()
mdata.mod["fish"] = mdata["fish"][:, [g for g in mdata["fish"].var_names if g != imputed_gene]].copy()
mdata
[5]:
MuData object with n_obs × n_vars = 7528 × 15254
  obs:      'celltype', 'modality'
  2 modalities
    fish:   4523 × 32
      obs:  'x_coord', 'y_coord', 'n_genes'
      var:  'n_cells'
      layers:       None
    rna:    3005 × 15221
      obs:  'n_genes'
      var:  'n_cells'
      layers:       None
Preprocess common features and obtain cross-modality distance matrix
Diagonal integration, i.e. single cell multimodal unpaired integration, is a very challenging task as it aims at aligning cells in which different features were measured. To guide the alignment, we need to leverage prior biological knowledge to obtain a set of common features across modalities which will serve as a bridge for the integration. For scRNA-smFISH integration, those common features are the genes that have been measured in both experiments.
[6]:
# Keep only common genes
cm_genes = list(set(mdata["rna"].var_names) & set(mdata["fish"].var_names))
cm_features_rna = mdata["rna"][:, cm_genes].copy()
cm_features_fish = mdata["fish"][:, cm_genes].copy()
[7]:
# Log normalize the scRNA counts
sc.pp.normalize_total(cm_features_rna, target_sum=1000.)
sc.pp.log1p(cm_features_rna)
/var/folders/ps/n_xnzwbn2sj14h3zydyd5dgr0000gp/T/ipykernel_57363/4015046589.py:2: UserWarning: Some cells have zero counts
  sc.pp.normalize_total(cm_features_rna, target_sum=1000.)
To preprocess the smFISH counts, we use the same normalization technique as the authors of the dataset.
[8]:
def normalize_fish(array, col_factor=None):
    array = array / array.sum(axis=1, keepdims=True)  # Corrected for total molecules per gene
    if col_factor is None:
        col_factor = array.mean(axis=0, keepdims=True)
    array = array / col_factor  # * array.shape[1]
    return array
[9]:
# Normalize the fish counts
cm_features_fish.X = normalize_fish(cm_features_fish.X)
Once those common feature representations have been obtained, we can derive a distance matrix whose rows correspond to RNA cells and columns to FISH cells. Correlation distance is undefined for constant vectors (including cells with no expression in the shared genes) or non-finite values. We exclude those cells from both the common-feature representations and their original modalities before computing the prior, and keep the held-out FISH expression aligned. In this demo this removes nine RNA cells.
[10]:
# Correlation requires finite, nonconstant shared-feature vectors.
keep_rna = np.isfinite(cm_features_rna.X).all(axis=1) & (np.ptp(cm_features_rna.X, axis=1) > 0)
keep_fish = np.isfinite(cm_features_fish.X).all(axis=1) & (np.ptp(cm_features_fish.X, axis=1) > 0)
if not keep_rna.any() or not keep_fish.any():
    raise ValueError("No cells with valid shared-feature correlation remain in one modality")
print(f"Excluding {(~keep_rna).sum()} RNA and {(~keep_fish).sum()} FISH cells with undefined correlation")

mdata.mod["rna"] = mdata["rna"][keep_rna].copy()
mdata.mod["fish"] = mdata["fish"][keep_fish].copy()
cm_features_rna = cm_features_rna[keep_rna].copy()
cm_features_fish = cm_features_fish[keep_fish].copy()
heldout_counts = heldout_counts[keep_fish]
mdata.update()

cross_cost = cdist(cm_features_rna.X, cm_features_fish.X, metric="correlation")
assert np.isfinite(cross_cost).all(), "The cross-modality cost must be finite"
mdata.uns["cross_rna+fish"] = cross_cost
mdata.uns["cross_keys"] = ["cross_rna+fish"]
Excluding 9 RNA and 0 FISH cells with undefined correlation
/Users/julessamara/Projects/scconfluence/.venv/lib/python3.14/site-packages/mudata/_core/mudata.py:613: UserWarning: Cannot join columns with the same name because var_names are intersecting.
  self._update_attr_legacy(attr, axis, join_common, **kwargs)
Preprocess each modality
While the computation of the distance matrix only involved genes that were present both in the scRNA modality and the smFISH, our method leverages the original features of each modalities (i.e. all genes for the scRNA) to perform dimension reductions. Therefore, we need to preprocess each modality separately once again.
[11]:
mdata["rna"].layers["counts"] = mdata["rna"].X.copy()

# Log-normalize the scRNA counts
sc.pp.normalize_total(mdata["rna"], target_sum=10000.)
sc.pp.log1p(mdata["rna"])

# Since we use both raw and normalized gene counts it makes sense to select highly variable genes based on both criteria
raw_hvg = sc.pp.highly_variable_genes(mdata["rna"], layer="counts", n_top_genes=3000, subset=False, inplace=False,
                                     flavor="seurat_v3")["highly_variable"].values
norm_hvg = sc.pp.highly_variable_genes(mdata["rna"], n_top_genes=3000, subset=False,
                                       inplace=False)["highly_variable"].values
mdata.mod["rna"] = mdata["rna"][:, np.logical_or(raw_hvg, norm_hvg)].copy()

# Perform PCA on the selected genes
sc.tl.pca(mdata["rna"], n_comps=100, zero_center=None)
[12]:
mdata.mod["fish"].X = normalize_fish(mdata["fish"].X)
Define autoencoders for each modality
We define one autoencoder per modality whose aim is to extract all the biological information present in the original features while accounting for batch effects (not present here since there’s only one batch) and projecting the cells to a shared latent space of low dimension (hence the dimension of the latent space n_latent should be the same for all autoencoders).
Multiple options can be set to adapt the autoencoders to the specificity of the modalities measured, see the API’s documention for details about the arguments. We here use lower n_hiddenand n_layers_enc than their default values since the smFISh measurements don’t contain many features.
[13]:
autoencoders = {"rna": scconfluence.unimodal.AutoEncoder(mdata["rna"],
                                                         modality="rna",
                                                         rep_in="X_pca",
                                                         rep_out="counts",
                                                         batch_key=None,
                                                         n_hidden=64,
                                                         n_latent=16,
                                                         type_loss="zinb"),
                "fish": scconfluence.unimodal.AutoEncoder(mdata["fish"],
                                                          modality="fish",
                                                          n_layers_enc=2,
                                                          rep_in=None,
                                                          rep_out=None,
                                                          batch_key=None,
                                                          n_hidden=25,
                                                          n_latent=16,
                                                          type_loss="l2")}
Create and train the model
The scConfluence model leverages the distance matrix stored in mdata to align the latent embeddings learned by autoencoders from each modality. We used here the default parameters except for iot_loss_weight and reach. Indeed, here since the gene to gene connections which allow us to compute the cross-modality distance matrix are extremely reliable, we can increase the importance of the alignment term in the total loss. Increasing reach allow us to enforce an even tighter mixing
of the modalities in the latent space, which is necessary for successful imputation. See the API’s documention or the FAQ for details on this. While the maximum over of epochs is set to 1000, we use earlystopping to interrupt the training when the loss has converged on validation samples which generally happens long before the upper limit of 1000 epochs. With a GPU, this
training is expected to take less than 5 minutes.
[14]:
%%time
%%capture
model = scconfluence.model.ScConfluence(mdata=mdata, unimodal_aes=autoencoders,
                                        mass=0.5, reach=1., iot_loss_weight=0.05, sinkhorn_loss_weight=0.1)
model.fit(save_path="demo_rna_fish", use_cuda=True, max_epochs=1000)
GPU available: True (mps), used: False
TPU available: False, using: 0 TPU cores
💡 Tip: For seamless cloud logging and experiment tracking, try installing [litlogger](https://pypi.org/project/litlogger/) to enable LitLogger, which logs metrics and artifacts automatically to the Lightning Experiments platform.

  | Name | Type       | Params | Mode  | FLOPs
----------------------------------------------------
0 | aes  | ModuleDict | 817 K  | train | 0
----------------------------------------------------
817 K     Trainable params
0         Non-trainable params
817 K     Total params
3.270     Total estimated model params size (MB)
43        Modules in train mode
0         Modules in eval mode
0         Total Flops
CPU times: user 10min 43s, sys: 1min 3s, total: 11min 47s
Wall time: 4min 49s
Obtaining and visualizing latent embeddings of all cells
[15]:
mdata.obsm["latent"] = model.get_latent(use_cuda=True).loc[mdata.obs_names]
GPU available: True (mps), used: False
TPU available: False, using: 0 TPU cores
💡 Tip: For seamless cloud logging and experiment tracking, try installing [litlogger](https://pypi.org/project/litlogger/) to enable LitLogger, which logs metrics and artifacts automatically to the Lightning Experiments platform.
💡 Tip: For seamless cloud uploads and versioning, try installing [litmodels](https://pypi.org/project/litmodels/) to enable LitModelCheckpoint, which syncs automatically with the Lightning model registry.
/Users/julessamara/Projects/scconfluence/.venv/lib/python3.14/site-packages/pytorch_lightning/trainer/connectors/data_connector.py:434: The 'predict_dataloader' does not have many workers which may be a bottleneck. Consider increasing the value of the `num_workers` argument` to `num_workers=14` in the `DataLoader` to improve performance.
Predicting DataLoader 0: 100%|██████████| 15/15 [00:00<00:00, 325.65it/s]
While conclusions should not be drawn from UMAP plots we use it here to visualize the results of the integration.
[16]:
sc.pp.neighbors(mdata, use_rep="latent", key_added="scConfluence")
sc.tl.umap(mdata, neighbors_key="scConfluence")
sc.pl.umap(mdata, color=["modality", "celltype"], size=50, alpha=0.7)

Imputing heldout measurements
Now that the model has been trained, we can use the RNA decoder to predict gene expression measurements from the smFISH latent embeddings.
[17]:
imputed_gene_idx = list(mdata["rna"].var_names).index(imputed_gene)
mdata["fish"].obs[f"imputed_{imputed_gene}"] = model.get_imputation(use_cuda=True,
                                                                    impute_from="fish",
                                                                    impute_to="rna").iloc[:, imputed_gene_idx].loc[mdata["fish"].obs_names]
GPU available: True (mps), used: False
TPU available: False, using: 0 TPU cores
/Users/julessamara/Projects/scconfluence/.venv/lib/python3.14/site-packages/pytorch_lightning/trainer/setup.py:175: GPU available but not used. You can set it by doing `Trainer(accelerator='gpu')`.
💡 Tip: For seamless cloud logging and experiment tracking, try installing [litlogger](https://pypi.org/project/litlogger/) to enable LitLogger, which logs metrics and artifacts automatically to the Lightning Experiments platform.
💡 Tip: For seamless cloud uploads and versioning, try installing [litmodels](https://pypi.org/project/litmodels/) to enable LitModelCheckpoint, which syncs automatically with the Lightning model registry.
/Users/julessamara/Projects/scconfluence/.venv/lib/python3.14/site-packages/pytorch_lightning/trainer/connectors/data_connector.py:434: The 'predict_dataloader' does not have many workers which may be a bottleneck. Consider increasing the value of the `num_workers` argument` to `num_workers=14` in the `DataLoader` to improve performance.
/Users/julessamara/Projects/scconfluence/.venv/lib/python3.14/site-packages/torch/utils/data/dataloader.py:759: UserWarning: 'pin_memory' argument is set as true but not supported on MPS now, device pinned memory won't be used.
  super().__init__(loader)
Predicting DataLoader 0: 100%|██████████| 9/9 [00:00<00:00, 155.59it/s]
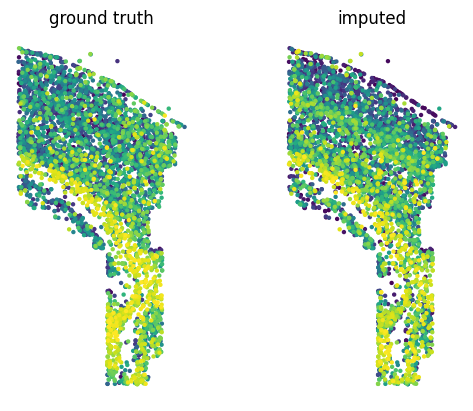
Since smFISH measurements come with 2D positions of the cells which were profiled, we can compare visually the spatial patterns of expression of the ground-truth and imputed expressions of the heldout gene.
[18]:
def plot_spatial_expression(ax, x_coord, y_coord, values, title, s=20):
    def order_by_strenght(x, y, z):
        ind = np.argsort(z)
        return x[ind], y[ind], z[ind]
    x, y, z = order_by_strenght(x_coord, y_coord, values)
    c = np.arange(len(z)) / len(z)
    ax.scatter(x, y, c=c, s=s, edgecolors="none", rasterized=True)#, marker="s")  # , cmap="Reds")
    ax.axis('scaled')
    ax.axis("off")
    ax.set_title(title)
[19]:
fig, (ax_gt, ax_imp) = plt.subplots(1, 2)
plot_spatial_expression(ax=ax_gt, x_coord=mdata["fish"].obs["x_coord"].values,
                        y_coord=mdata["fish"].obs["y_coord"].values,
                        values=heldout_counts.reshape(-1),
                        title="ground truth",
                        s=10)
plot_spatial_expression(ax=ax_imp, x_coord=mdata["fish"].obs["x_coord"].values,
                        y_coord=mdata["fish"].obs["y_coord"].values,
                        values=mdata["fish"].obs[f"imputed_{imputed_gene}"].values.reshape(-1),
                        title="imputed",
                        s=10)